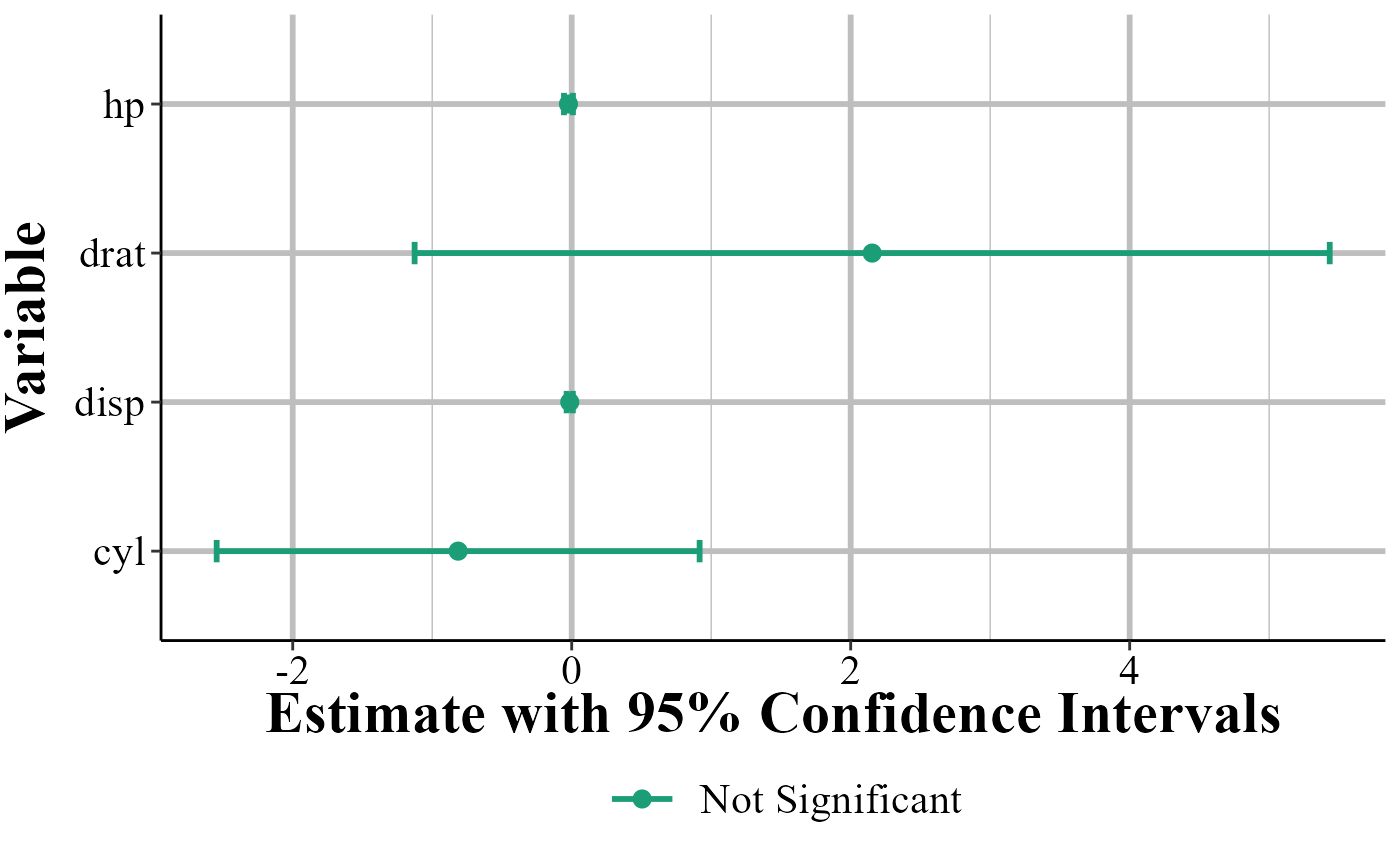
Make a graph of coefficient values and 95 percent confidence interval for regression.
Source:R/stats.R
make_regression_graph.RdMake a graph of coefficient values and 95 percent confidence interval for regression.
make_regression_graph(model, coefficients = NULL)Arguments
- model
A `lm` object made from making a model using `lm()`.
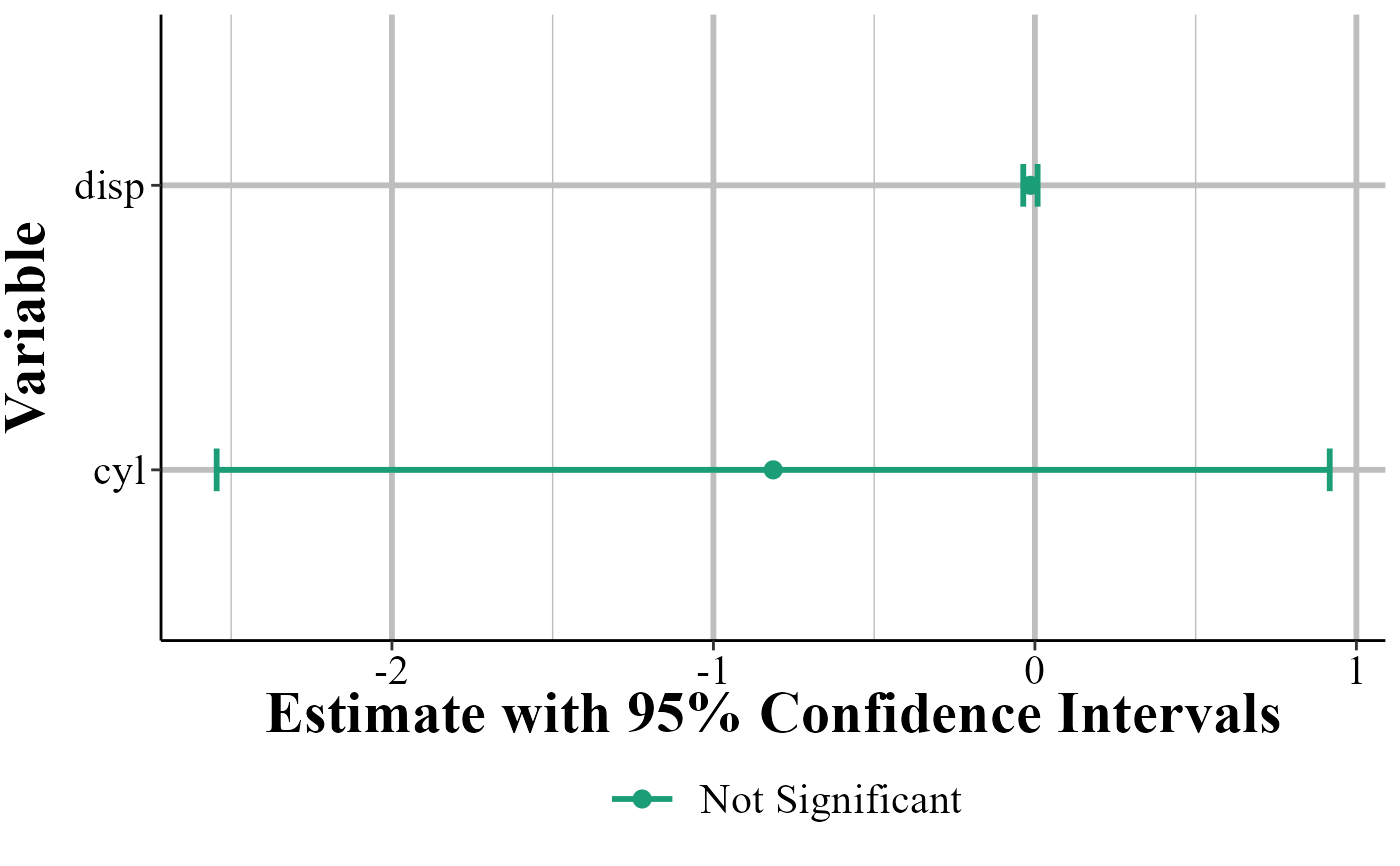
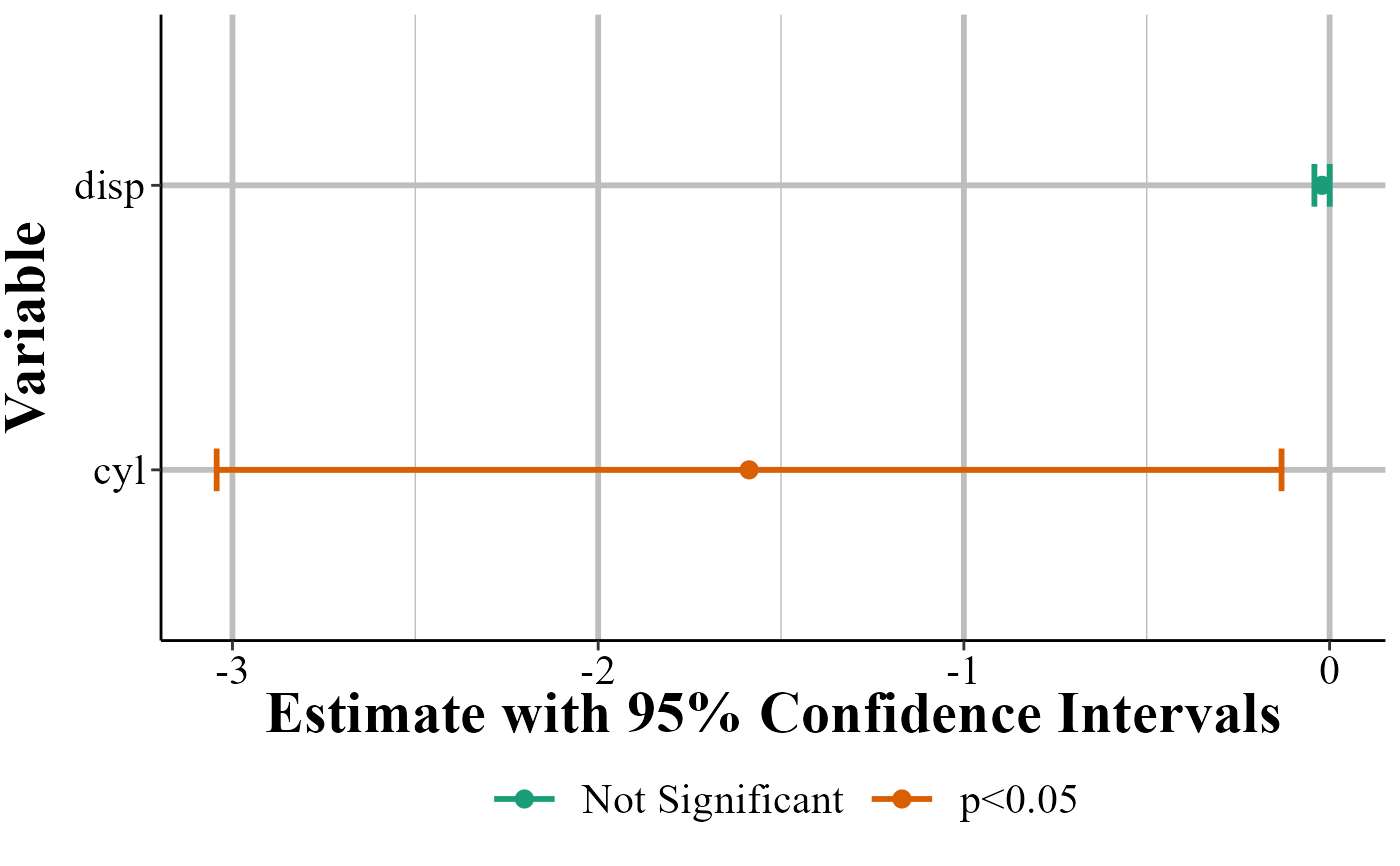
- coefficients
A string or vector of strings with the coefficient names. Will then make the graph only with those coefficients.
Value
Outputs a `ggplot2` graph